
Table of Contents
ToggleIntroduction
Website speed is no longer a “nice-to-have” feature. It is a critical success factor for SEO, user experience, and conversions. Users expect websites to load fast, especially on mobile devices. If your website takes more than a few seconds to load, visitors leave, bounce rates increase, and rankings drop.
This is where PageSpeed Insights becomes essential.
PageSpeed Insights is a free Google tool that analyzes your website’s speed and performance. It shows what is slowing your site down and provides clear, actionable recommendations to fix those issues.
In this comprehensive guide, you will learn:
What PageSpeed Insights is and how it works
Why page speed matters for SEO
Core Web Vitals explained with real-world examples
Step-by-step optimization techniques
Common mistakes and advanced improvements
Case studies and FAQs
This article is written for beginners, business owners, marketers, and developers who want real results—not just theory.
What is PageSpeed Insights?
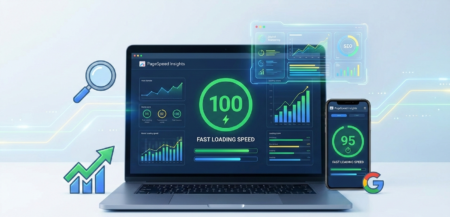
PageSpeed Insights (PSI) is a performance testing tool created by Google. It analyzes a web page and generates a performance score based on speed, responsiveness, and visual stability.
The tool tests pages on:
Mobile devices
Desktop devices
Each test produces a score from 0 to 100:
| Score Range | Meaning |
|---|---|
| 90–100 | Excellent |
| 50–89 | Needs improvement |
| 0–49 | Poor |
Along with the score, PageSpeed Insights provides:
Core Web Vitals data
Lab data (simulated tests)
Field data (real-user experience)
Detailed optimization suggestions
Example:
A content-heavy blog may score 85 on desktop but only 42 on mobile due to large images and unused JavaScript.
Why Page Speed Matters
Page speed affects:
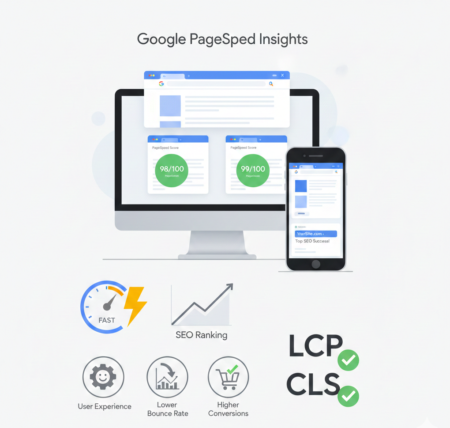
User Experience: Faster websites keep visitors engaged. Slow sites increase bounce rates.
SEO Rankings: Google considers page speed a ranking factor. Better speed improves Core Web Vitals, which are crucial for SEO.
Conversions: A 1-second improvement can increase conversions by 20–30%.
Mobile Optimization: Mobile users expect quick, smooth browsing, and slow pages drive them away.
Mini Case Study:
An e-commerce store noticed high cart abandonment. Their PSI score was 48. After compressing images, enabling caching, and using a CDN, the score jumped to 92. Bounce rate dropped by 35%, and sales increased by 28%.
Core Metrics in PageSpeed Insights
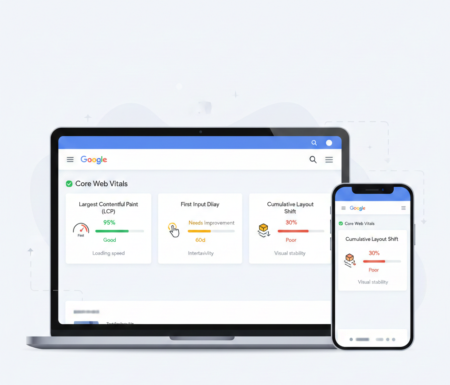
PageSpeed Insights measures several key metrics, focusing mainly on Core Web Vitals.
1. Largest Contentful Paint (LCP)
Measures the time it takes for the main content to load.
Ideal LCP: ≤2.5 seconds
Example: For an e-commerce homepage, LCP could be the main banner or product image. Optimizing image size and using lazy loading reduces LCP.
2. First Input Delay (FID)
Measures the time before a page responds to user input.
Ideal FID: ≤100 milliseconds
Example: For a contact form, users should be able to click and type immediately. Reducing heavy JavaScript and unnecessary plugins improves FID.
3. Cumulative Layout Shift (CLS)
Measures visual stability—how much elements shift unexpectedly.
Ideal CLS: <0.1
Example: Pop-ups or ad banners can push content down. Assign fixed sizes to images and ads to prevent shifts.
4. Total Blocking Time (TBT)
Measures responsiveness delays due to long-running scripts.
Lower TBT = faster, smoother experience.
How to Use PageSpeed Insights
Step 1: Enter Your URL
Visit PageSpeed Insights, paste your page URL, and click Analyze.
Step 2: Review the Scores
PSI provides scores for mobile and desktop separately. It also gives:
Performance Score
Field Data (real-world usage)
Lab Data (simulated performance)
Opportunities & Diagnostics
Step 3: Implement Recommendations
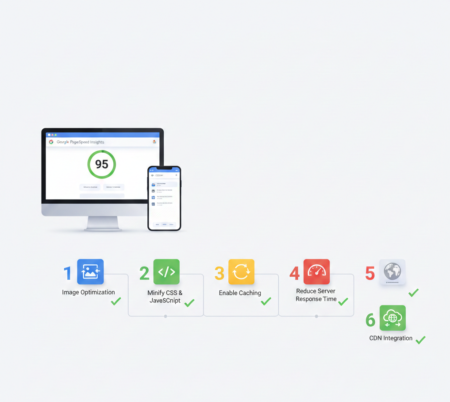
PSI prioritizes suggestions like:
Optimize images (WebP, AVIF)
Minify CSS, JavaScript, and HTML
Enable caching
Reduce server response time
Mini Scenario: A blog with many large images improved its LCP from 4.5s to 2.1s after optimizing images and enabling lazy loading, increasing page engagement by 40%.
Step-by-Step Optimization Techniques
1. Image Optimization
Compress images without quality loss using TinyPNG or ImageOptim
Use modern formats: WebP or AVIF
Implement lazy loading for images below the fold
Table: Before & After Image Optimization Impact
| Metric | Before Optimization | After Optimization |
|---|---|---|
| LCP | 4.5s | 2.0s |
| Page Size | 5.2 MB | 2.1 MB |
| Mobile Score | 48 | 91 |
2. Minify CSS, JavaScript, HTML
Remove unnecessary spaces and comments
Combine multiple files to reduce HTTP requests
Tools: Autoptimize, WP Rocket
Example: A travel blog reduced CSS and JS files from 25 to 10, cutting TBT by 70ms and boosting performance score by 18 points.
3. Enable Browser Caching
Store static assets in the browser to reduce reload time
Set cache expiry for images, JS, and CSS
Tools:
.htaccesstweaks for Apache, Nginx configs
4. Use a Content Delivery Network (CDN)
Distribute content across multiple servers globally
Faster loading for users in different regions
Popular options: Cloudflare, Amazon CloudFront, StackPath
Mini Case Scenario: A SaaS company reduced global page load from 4.8s to 2.3s using a CDN, improving user retention in Europe and Asia.
5. Reduce Server Response Time
Choose reliable hosting
Enable server-side caching (Varnish, Redis)
Optimize database queries and use optimized CMS
Real-world Tip: Switching from shared hosting to managed WordPress hosting improved one client’s TTFB from 1.2s to 0.4s.
Desktop vs Mobile Optimization
| Device | Common Issues | Solutions |
|---|---|---|
| Mobile | Large images, slow JS | Optimize images, defer JS, responsive design |
| Desktop | Heavy animations, large files | Minify files, lazy load images |
Tip: Mobile-first optimization is critical due to mobile-first indexing by Google.
Common Mistakes to Avoid
Ignoring mobile optimization
Installing too many plugins
Skipping image optimization
Using slow or cheap hosting
Not monitoring PSI regularly
Tools Complementing PageSpeed Insights
GTmetrix: Provides detailed waterfall charts
Lighthouse: Audits performance, accessibility, SEO
Pingdom: Monitors uptime and load time
WebPageTest: Advanced real-world testing
Tip: Combining PSI with these tools gives a full picture of site speed.
Mini Case Studies
E-commerce Store: PSI score 48 → 92 after image compression, caching, and CDN. Bounce rate dropped 35%.
Travel Blog: PSI score 55 → 88 after CSS/JS minification and lazy loading. Session duration up 40%.
SaaS Landing Page: PSI score 60 → 95 after server optimization and font preloading. Lead conversions up 22%.
Advanced Tips for Developers
Preload critical CSS and fonts
Reduce JavaScript execution time
Use HTTP/2 or HTTP/3 protocols
Avoid redirect chains
Example: Preloading fonts on a tech blog reduced LCP by 0.8s.
Why PageSpeed Insights Is Important for SEO
Page speed directly affects how users interact with your website and how search engines rank it.
1. Page Speed Is a Google Ranking Factor
Google officially confirmed that page speed and Core Web Vitals are ranking signals. Faster websites have a competitive advantage in search results.
2. User Experience Matters
A slow website leads to:
Higher bounce rates
Lower engagement
Fewer conversions
Studies show that a delay of just 1 second can reduce conversions by up to 20%.
3. Mobile-First Indexing
Google primarily uses the mobile version of your site for indexing and ranking. Poor mobile performance in PageSpeed Insights can significantly impact SEO.
Extended FAQ
1. What is a good PageSpeed Insights score?
A score above 90 is excellent. Scores 50–89 need improvement, below 50 is poor.
2. How often should I check PageSpeed Insights?
Monthly or after major updates.
3. Can I improve PSI without coding skills?
Yes. WordPress plugins like WP Rocket or Autoptimize help non-developers.
4. Does PSI affect SEO directly?
Yes. Faster sites improve Core Web Vitals, impacting rankings.
5. Are mobile scores more important than desktop?
Yes, mobile-first indexing prioritizes mobile scores.
6. How long does optimization take?
Speed changes are immediate; SEO benefits may take weeks.
7. Do videos affect PageSpeed Insights scores?
Yes. Embed videos responsibly, use lazy loading, and avoid autoplay.
8. Can caching alone improve PSI?
Partially. Combine caching with image optimization, minification, and CDN for best results.
9. What’s the difference between Lab Data and Field Data?
Lab Data: Simulated conditions for diagnostics
Field Data: Real-world user performance
10. Are Core Web Vitals the only metrics that matter?
They are critical but combine with accessibility, SEO best practices, and security for full optimization.
Conclusion
PageSpeed Insights is your roadmap for website speed, better user experience, and SEO improvement. By following the practical steps, using the right tools, and continuously monitoring performance, you can achieve:
Faster page loads
Lower bounce rates
Higher conversion rates
Better search engine rankings